See your music. Hear your light.
AlbumViz is an interactive tool that transforms sound into color using real audio data and scientific mapping. Whether you enter an album name or a YouTube music video, AlbumViz analyzes the full frequency spectrum of the audio — from sub-bass at 20 Hz to piercing highs at 20,000 Hz — and converts it into visible light wavelengths between 400 nm (violet) and 700 nm (red).
🎨 Why AlbumViz Matters
Music is more than just sound—it's an experience that can evoke powerful emotions, memories, and even visual imagery. AlbumViz bridges the gap between hearing and seeing by translating the unique frequency patterns of your favorite songs into vibrant color gradients. This process not only creates beautiful visual art but also provides a new way to understand and appreciate the structure of music.
For musicians, AlbumViz offers a fresh perspective on composition and arrangement, revealing the hidden architecture of sound. For educators, it serves as a valuable teaching tool to demonstrate the relationship between physics, math, and art. And for music lovers, it’s a fun and engaging way to explore the songs you love in a whole new light—literally!
Each visualization is unique, reflecting the dynamic range and complexity of the audio. From the deep, pulsing bass of electronic music to the soaring highs of a violin solo, AlbumViz captures it all and presents it as a continuous spectrum of color. This not only makes for stunning visuals but also helps you "see" the energy and emotion embedded in every track.
🔬 How It Works
AlbumViz uses advanced audio analysis techniques to break down your music into its core components. The process starts by dividing the audio into 1,000 segments, regardless of the song's length. For each segment, the dominant frequency is detected using digital signal processing algorithms. This frequency is then mapped to a specific wavelength of visible light using a logarithmic scale, ensuring that the full range of human hearing is represented proportionally in the color spectrum.
- Upload your song, playlist, album, or link from YouTube.
- The song is cut into 1,000 segments (different songs are different lengths).
- For each segment, the dominant frequency (between 20 Hz and 20,000 Hz) is detected.
- This frequency is plugged into a logarithmic equation to get a wavelength between 400 nm (violet) and 700 nm (red).
- Each wavelength is mapped to a specific color (e.g., 400 nm = violet, 700 nm = red).
- All the colors are collected in order.
- The result is a beautiful gradient that visually represents your music!
Our ears perceive sound logarithmically, meaning we’re more sensitive to ratios of frequencies than to absolute differences. AlbumViz reflects this by converting the logarithm of frequency into visible color.
This approach is grounded in both psychoacoustics and physics. The logarithmic mapping ensures that low and high frequencies are represented fairly, mimicking the way our ears naturally interpret sound. The result is a visualization that is both scientifically accurate and aesthetically pleasing.
Here’s the formula used:
$$\lambda = 700 - 300 \times \frac{\log_{10}(f) - \log_{10}(20)}{\log_{10}(20000) - \log_{10}(20)}$$
\(\lambda\): Wavelength in nanometers (400–700 nm)f: Frequency in Hz (20–20,000 Hz)
By applying this formula, AlbumViz ensures that every nuance in your music is captured and translated into a corresponding color, creating a one-of-a-kind visual fingerprint for each track.
🛠 Features
- Analyzes any music video/playlist on YouTube
- Splits audio into 1,000 pieces and finds the dominant frequency at each point
- Maps dominant frequency to visible light color using logarithmic scaling
- Renders a colorful strip that visualizes the entire song as a gradient
- No data collection — fully offline capable
- Generates a .png file of the visualization that can be used as a poster
- Perfect for gifts for music and science lovers alike
- Supports a wide range of audio formats and sources
- Easy-to-use interface with step-by-step instructions
- Open source and customizable for advanced users
Whether you want to create a unique piece of art, analyze the structure of your favorite songs, or simply have fun exploring the intersection of music and color, AlbumViz has you covered.
📦 Download
AlbumViz is available as a free and open-source project. You can download the latest version directly from GitHub. The application is lightweight and runs on most modern computers without the need for an internet connection.
💻 GitHub Repository
Want to see how it works under the hood or contribute to the project? Check out the source code on GitHub. Contributions, bug reports, and feature requests are always welcome!
📝 How to Use On Your Computer!
- Clone or download this repo
- Make sure Python and dependencies are installed
- Run: python RUNME.py
- Type in an album, playlist, or a YouTube URL
- Example: "Dark Side of the Moon by Pink Floyd"
- Or a YouTube playlist or album-length video
- Visualize and save the output .png file!
- Note: If you are getting errors and the video isn't loading even when you use a URL, you'll likely have to update yt-dlp. Go into the terminal and type "pip install yt-dlp --upgrade"
- Also, it takes a minute to load the video after initially hitting search, especially if it's a URL. You may need to be patient, even if it's not responsive for ~ 2 minutes.
The application is designed to be user-friendly, with clear prompts and helpful error messages. Even if you’re new to audio analysis or programming, you’ll find it easy to get started. For advanced users, the codebase is well-documented and modular, making it simple to add new features or customize the visualization process.
🖼 Demo
Curious about what AlbumViz can do? Here’s what the user interface looks like, along with a sample visualization generated from a popular album. Notice how the colors shift smoothly, reflecting the changing frequencies throughout the song.
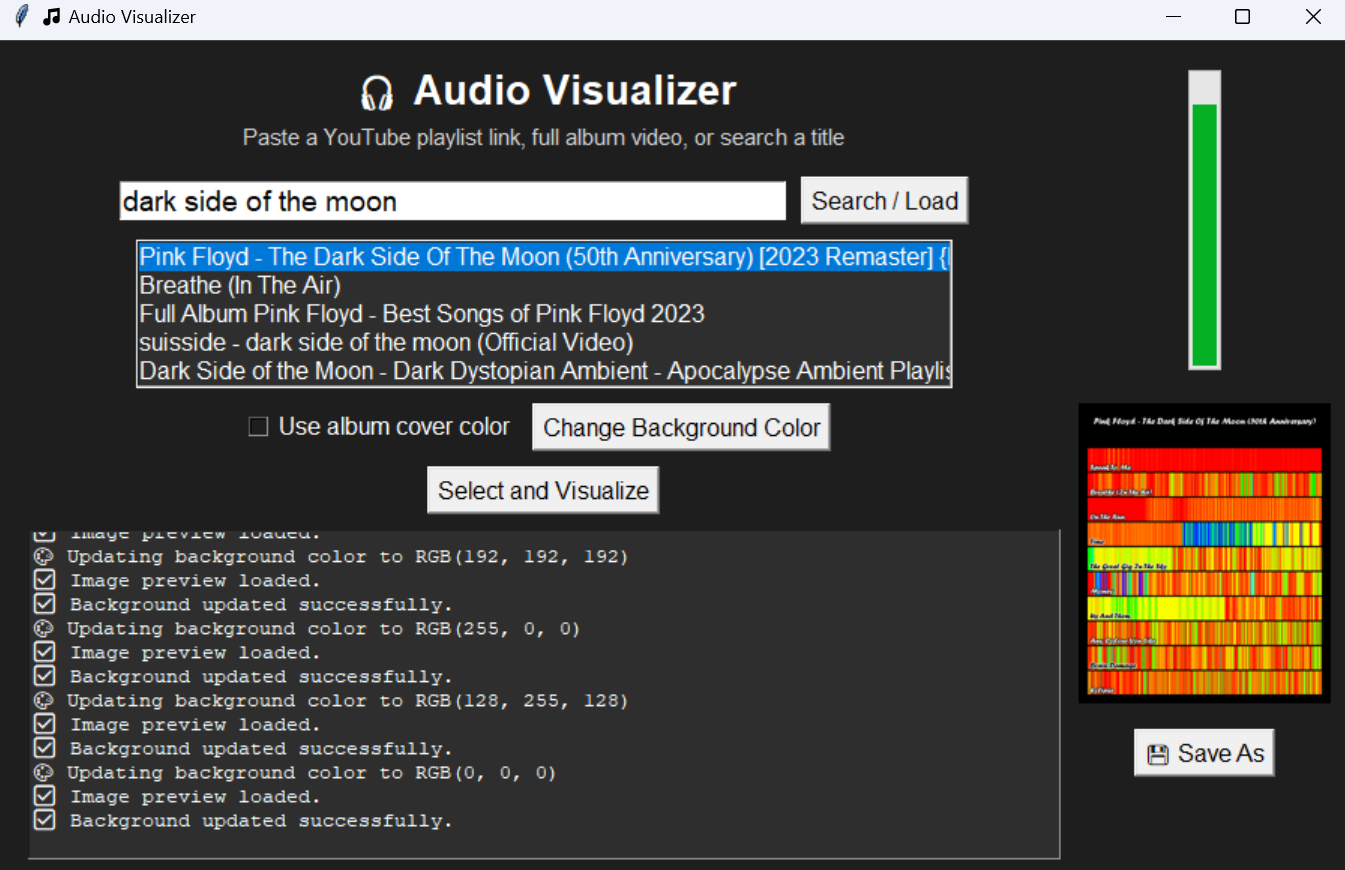
Each visualization is unique to the audio input, making it a perfect gift or conversation piece for music and science enthusiasts.
🔒 Privacy
Your privacy is important. AlbumViz runs completely offline and does not collect, transmit, or store any data. All processing is done locally on your device, ensuring that your music and personal information remain secure and private.
This makes AlbumViz ideal for use in classrooms, studios, and at home, without worrying about data privacy or internet connectivity.
🌟 Get Involved
AlbumViz is an open-source project, and we welcome contributions from the community. If you have ideas for new features, want to help improve the code, or simply want to share your visualizations, join us on GitHub! Together, we can make music more colorful for everyone.
For questions, feedback, or support, feel free to reach out via the contact page or open an issue on GitHub.