🎧 AlbumViz Examples
These visualizations were generated using AlbumViz by analyzing full albums or long-form tracks. Each image represents a translation of the audio frequency spectrum into visible light wavelengths (400–700 nm).
Pink Floyd – Dark Side of the Moon
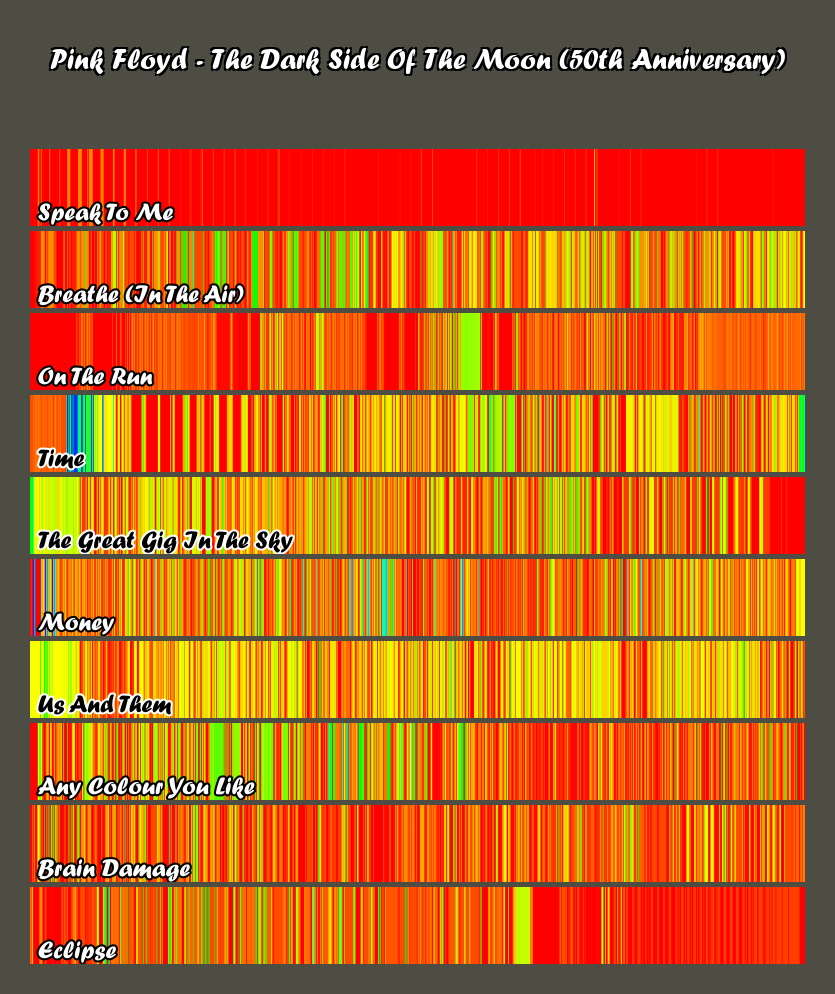
A classic progressive rock album with sweeping dynamic shifts and spacious mixes. The gradients of color reflect transitions from calm to chaos and back again.
Daft Punk – Random Access Memories
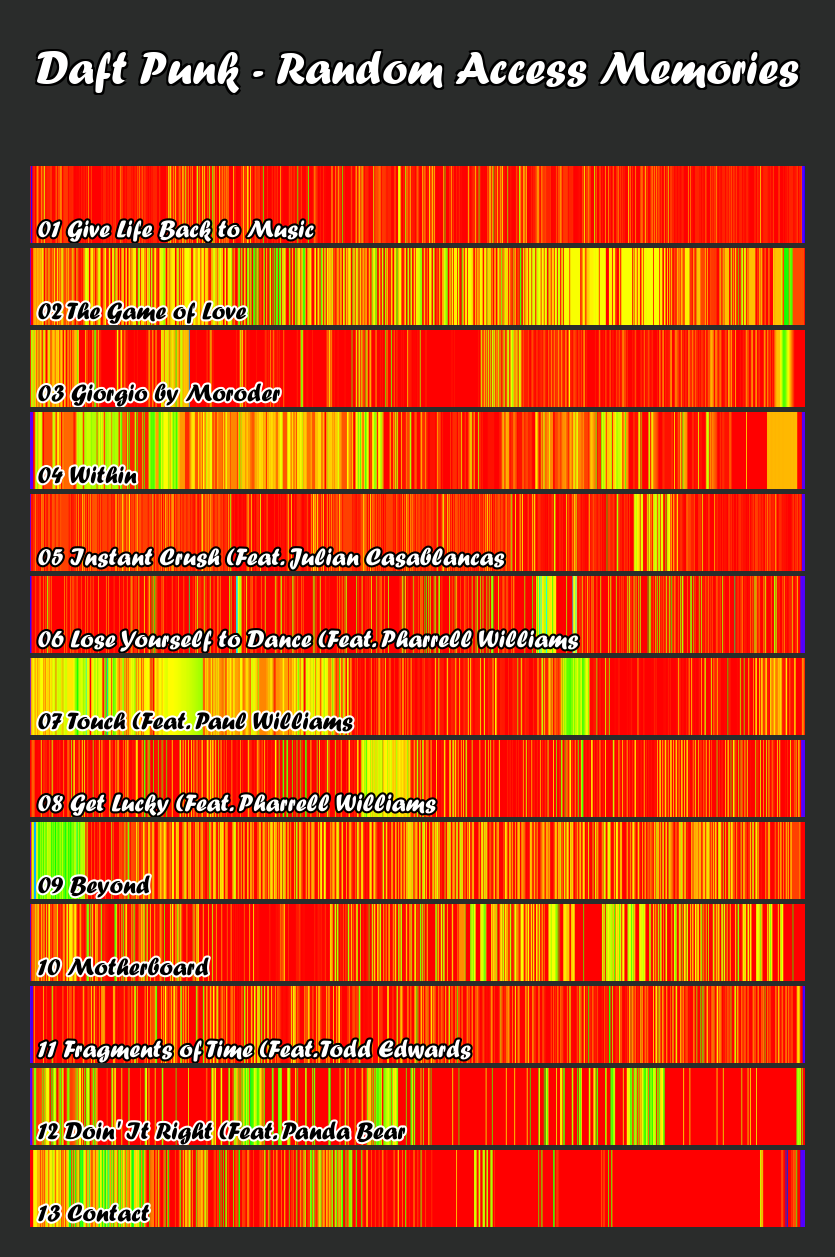
This electronic album features rhythmic synths and crisp production. Notice the consistent color pulses, reflecting steady mid-to-high frequency content.
Kendrick Lamar – To Pimp a Butterfly
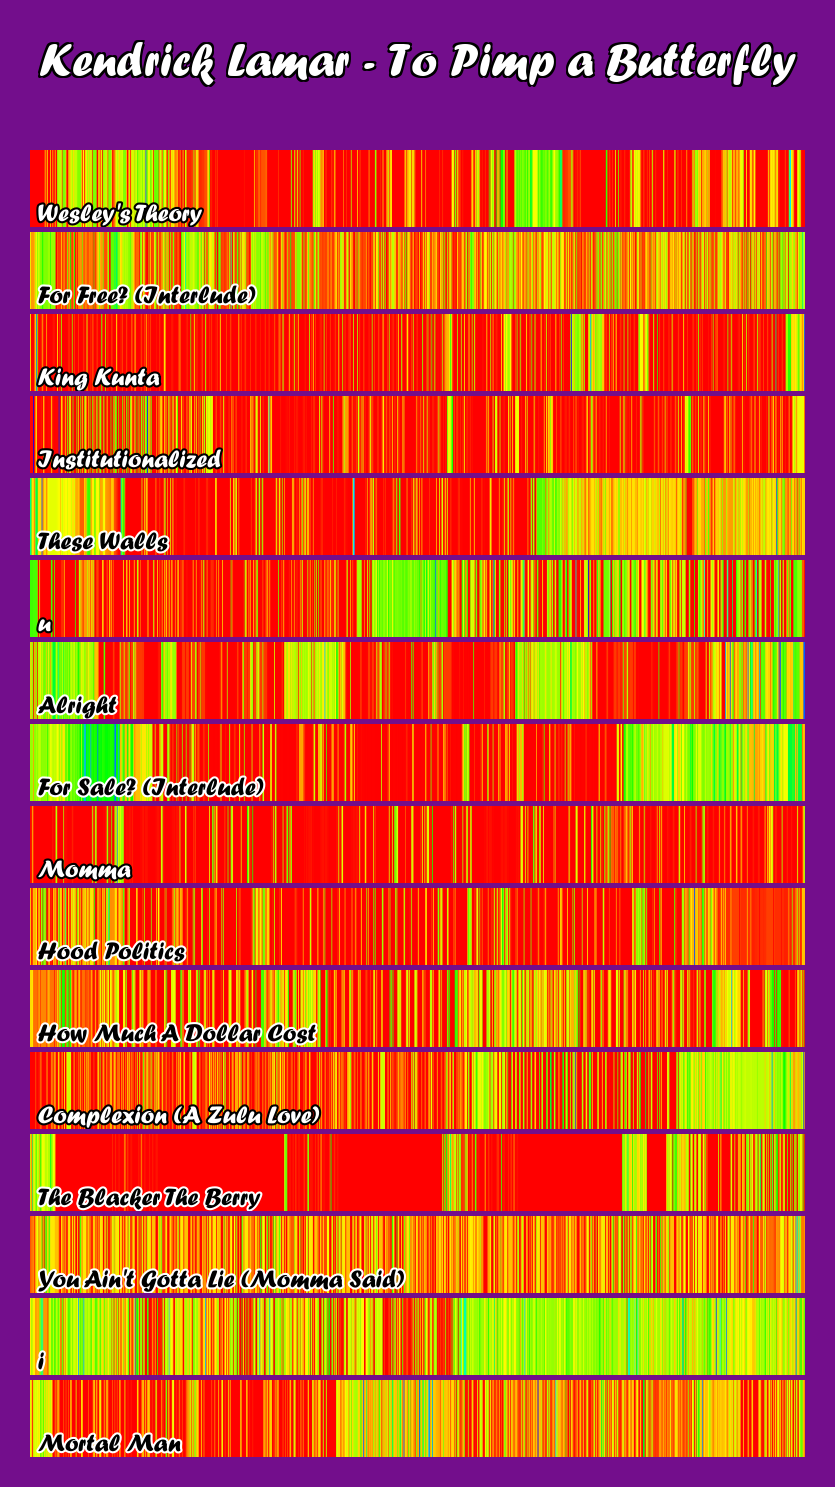
This hip-hop album mixes jazz, funk, and lyrical complexity. Strong midrange and low-end rhythms create a warm, earth-toned visual with bright highlights.
Radiohead – OK Computer
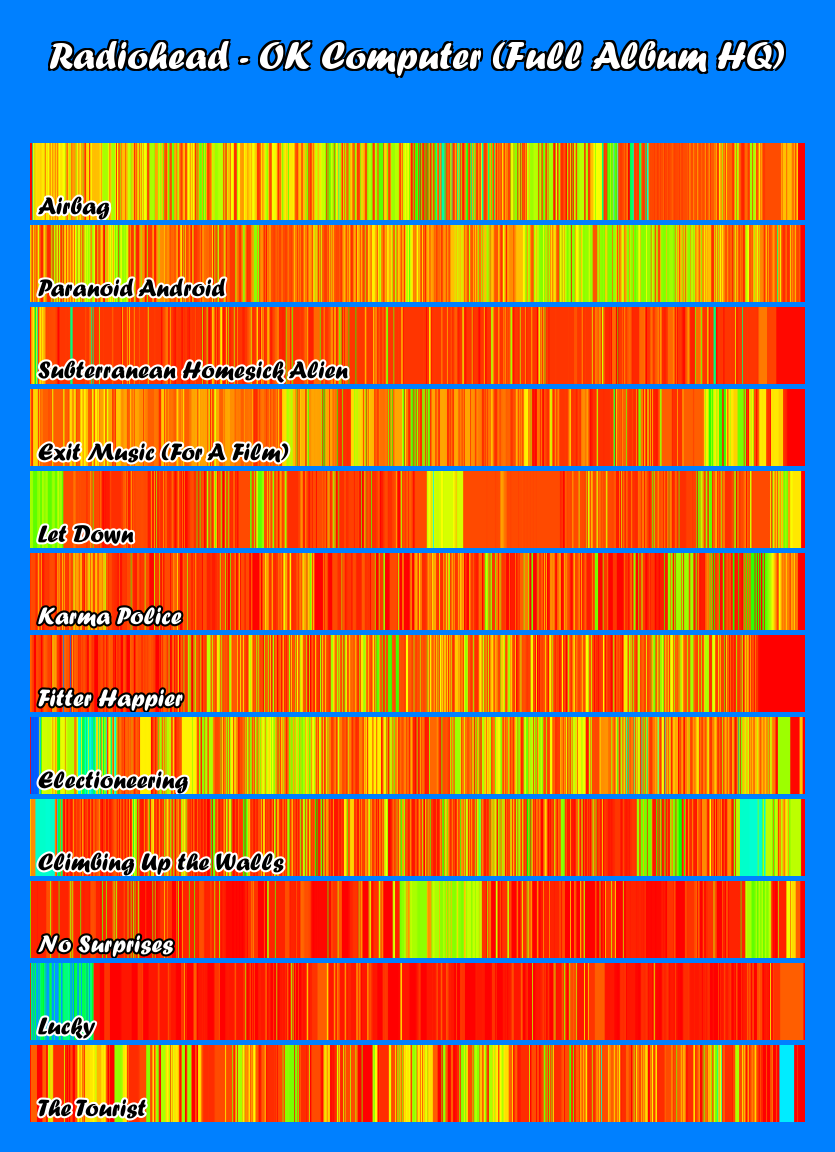
Radiohead’s ambient textures and dynamic guitar tones produce wave-like transitions of color that reflect the shifting emotional tone.
Billie Eilish – When We All Fall Asleep, Where Do We Go?
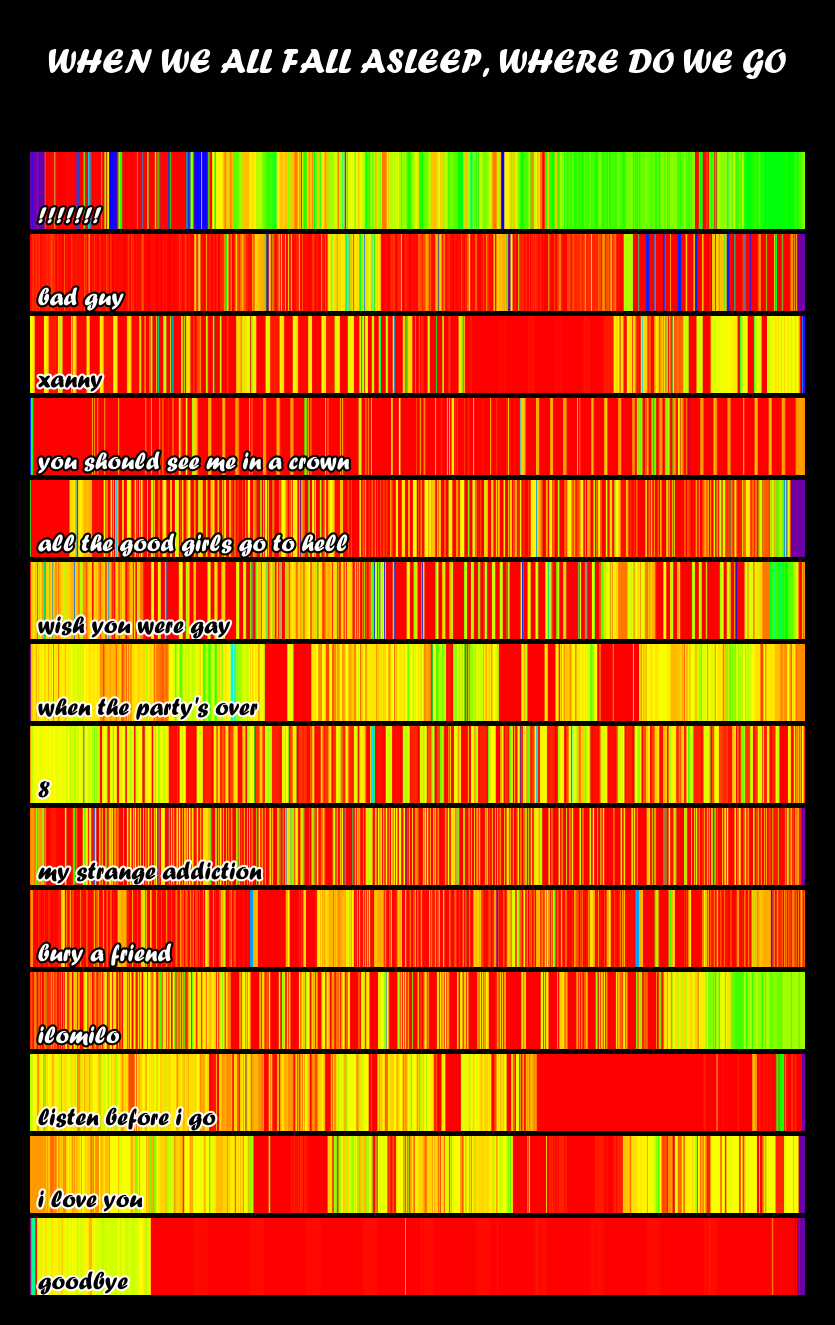
This minimalist pop album features deep sub-bass and whispery highs, leading to darker visuals with occasional high-frequency color spikes.
Hans Zimmer – Inception (Original Soundtrack)
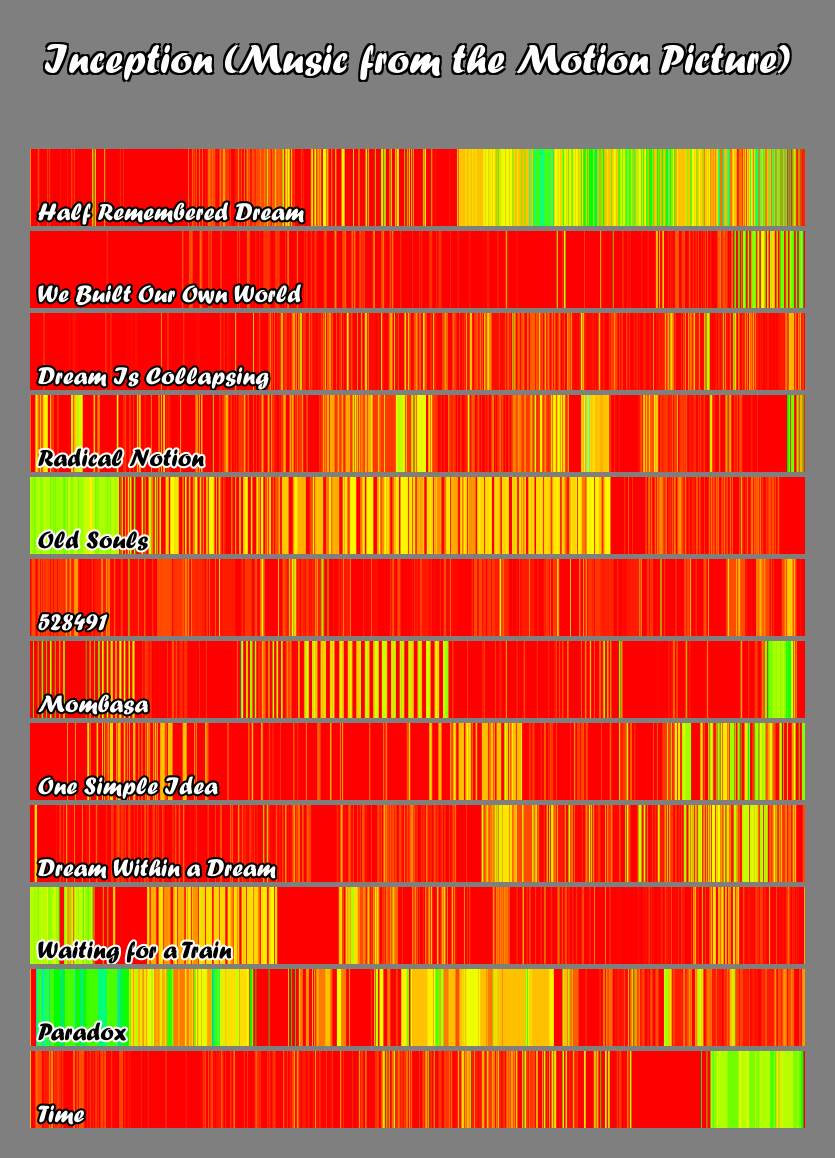
Zimmer’s cinematic score uses deep, resonant brass and bass, represented visually with bold reds and long low-frequency bands.